It’s generally assumed that it only takes a few years before solar panels have generated as much energy as it took to make them, resulting in very low greenhouse gas emissions compared to conventional grid electricity.
However, a more critical analysis shows that the cumulative energy and CO2 balance of the industry is negative, meaning that solar PV has actually increased energy use and greenhouse gas emissions instead of lowering them.
The problem is that we use and produce solar panels in the wrong places. By carefully selecting the location of both manufacturing and installation, the potential of solar power could be huge.
The Good News
There’s nothing but good news about solar energy these days. The average global price of PV panels has plummeted by more than 75% since 2008, and this trend is expected to continue in the coming years, though at a lower rate. 12
According to the 2015 solar outlook by investment bank Deutsche Bank, solar systems will be at grid parity in up to 80% of the global market by the end of 2017, meaning that PV electricity will be cost-effective compared to electricity from the grid. 34
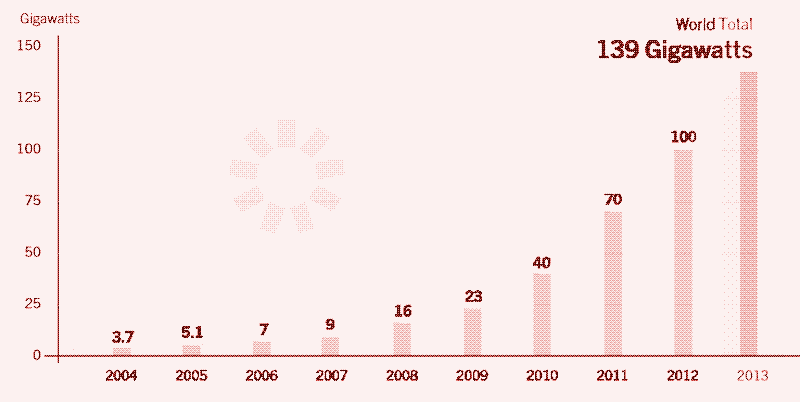
Lower costs have spurred an increase in solar PV installments. According to the Renewables 2014 Global Status Report, a record of more than 39 gigawatt (GW) of solar PV capacity was added in 2013, which brings total (peak) capacity worldwide to 139 GW at the end of 2013. While this is not even enough to generate 1% of global electricity demand, the growth is impressive. Almost half of all PV capacity in operation today was added in the past two years (2012-2013). 5 In 2014, an estimated 45 GW was added, bringing the total to 184 GW. 64
Meanwhile, solar cells are becoming more energy efficient, and the same goes for the technology used to manufacture them. For example, the polysilicon content in solar cells — the most energy-intensive component — has come down to 5.5-6.0 grams per watt peak (g/wp), a number that will further decrease to 4.5-5.0 g/wp in 2017. 2
Both trends have a positive effect on the sustainability of solar PV systems. According to the latest life cycle analyses, which measure the environmental impact of solar panels from production to decommission, greenhouse gas emissions have come down to around 30 grams of CO2-equivalents per kilwatt-hour of electricity generated (gCO2e/kWh), compared to 40-50 grams of CO2-equivalents ten years ago. 789101112
According to these numbers, electricity generated by photovoltaic systems is 15 times less carbon-intensive than electricity generated by a natural gas plant (450 gCO2e/kWh), and at least 30 times less carbon-intensive than electricity generated by a coal plant (+1,000 gCO2e/kWh). The most-cited energy payback times (EPBT) for solar PV systems are between one and two years. It seems that photovoltaic power, around since the 1970s, is finally ready to take over the role of fossil fuels.
Manufacturing of Solar Panels has Moved to China
Unfortunately, a critical review of the PV solar industry paints a very different picture. Many commenters attribute the plummeting cost of solar PV to more efficient manufacturing processes and scale economies. However, if we look at the graph below, we see that the decline in costs accelerates sharply from 2009 onwards.
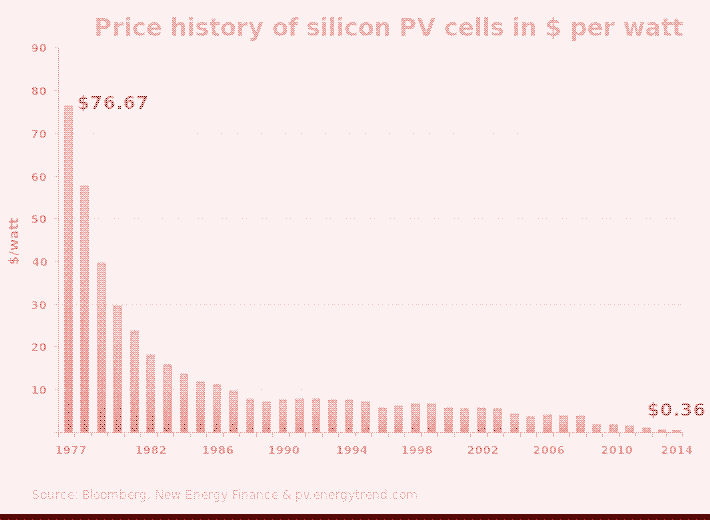
This acceleration has nothing to do with more efficient manufacturing processes or a technological breakthrough. Instead, it’s the consequence of moving almost the entire PV manufacturing industry from western countries to Asian countries, where labour and energy are cheaper and where environmental restrictions are more loose.
Less than 10 years ago, almost all solar panels were produced in Europe, Japan, and the USA. In 2013, Asia accounted for 87% of global production (up from 85% in 2012), with China producing 67% of the world total (62% in 2012). Europe’s share continued to fall, to 9% in 2013 (11% in 2012), while Japan’s share remained at 5% and the US share was only 2.6%. 5
Compared to Europe, Japan and the USA, the electric grid in China is about twice as carbon-intensive and about 50% less energy efficient. 131415 Because the manufacture of solar PV cells relies heavily on the use of electricity (for more than 95%) 16 this means that in spite of the lower prices and the increasing efficiency, the production of solar cells has become more energy-intensive, resulting in longer energy payback times and higher greenhouse gas emissions.
The geographical shift in manufacturing has made almost all life cycle analyses of solar PV panels obsolete, because they are based on a scenario of domestic manufacturing, either in Europe or in the United States.
LCA of Solar Panels Manufactured in China
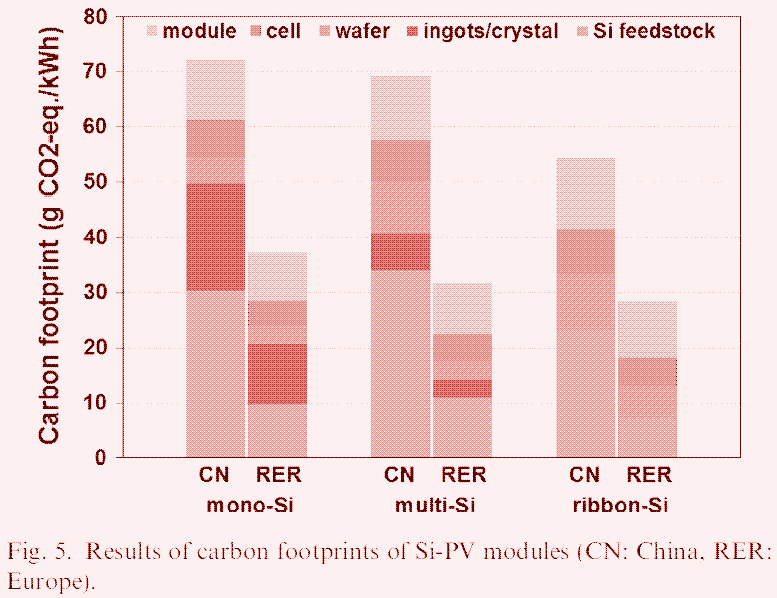
We could find only one study that investigates the manufacturing of solar panels in China, and it’s very recent. In 2014, a team of researchers performed a comparative life cycle analysis between domestic and overseas manufacturing scenarios, taking into account geographic diversity by utilizing localized inventory data for processes and materials. 13
In the domestic manufacturing scenario, silicon PV modules (mono-si with 14% efficiency and multi-si with 13.2% efficiency) are made and installed in Spain. In the overseas manufacturing scenario, the panels are made in China and installed in Spain.
For solar panels manufactured in China, the carbon footprint and the energy payback time are almost doubled
Compared to the domestic manufacturing scenario, the carbon footprint and the energy payback time are almost doubled in the overseas manufacturing scenario. The carbon footprint of the modules made in Spain (which has a cleaner grid than the average in Europe) is 37.3 and 31.8 gCO2e/kWh for mono-si and multi-si, respectively, while the energy payback times are 1.9 and 1.6 years. However, for the modules made in China, the carbon footprint is 72.2 and 69.2 gCO2e/kWh for mono-si and multi-si, respectively, while the energy payback times are 2.4 and 2.3 years. 13
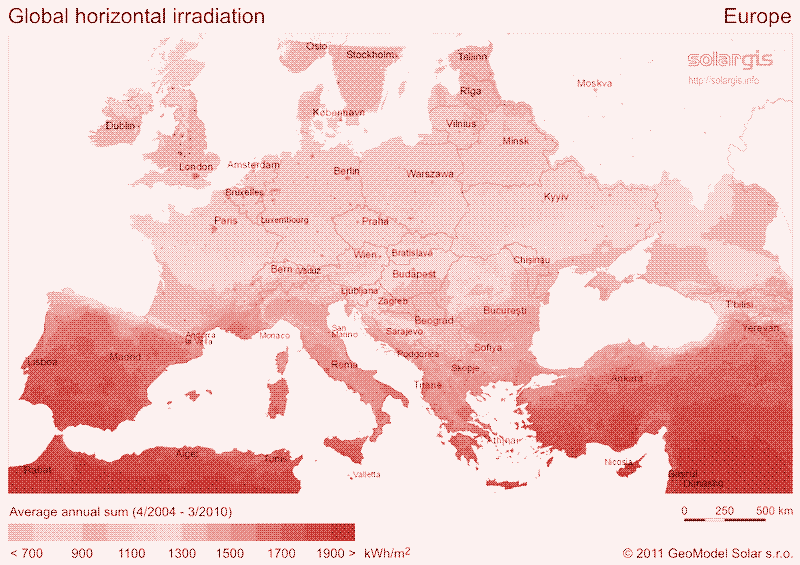
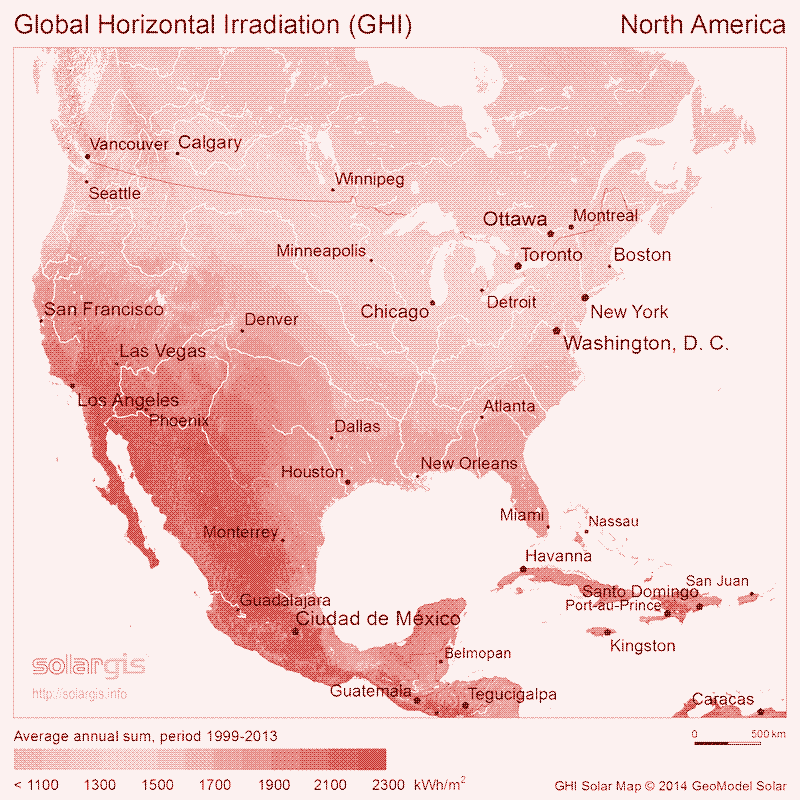
At least as important as the place of manufacturing is the place of installation. Almost all LCAs — including the one that deals with manufacturing in China — assume a solar insolation of 1,700 kilowatt-hour per square meter per year (kWh/m2/yr), typical of Southern Europe and the southwestern USA. If solar modules manufactured in China are installed in Germany, then the carbon footprint increases to about 120 gCO2e/kWh for both mono- and multi-si — which makes solar PV only 3.75 times less carbon-intensive than natural gas, not 15 times.
Considering that at the end of 2014, Germany had more solar PV installed than all Southern European nations combined, and twice as much as the entire United States, this number is not a worst-case scenario. It reflects the carbon intensity of most solar PV systems installed between 2009 and 2014. More critical researchers had already anticipated these results. A 2010 study refers to the 2008 consensus figure of 50 gCO2e/kWh mentioned above, and adds that “in less sunny locations, or in carbon-intensive economies, these emissions can be up to 2-4 times higher”. 17
Taking the more recent figure of 30 gCO2e/kWh as a starting point, which reflects improvements in solar cell and manufacturing efficiency, this would be 60-120 gCO2e/kWh, which corresponds neatly with the numbers of the 2014 study.
.
These results don’t include the energy required to ship the solar panels from China to Europe. Transportation is usually ignored in LCAs of solar panels that assume domestic production, which would make comparisons difficult. Furthermore, energy requirements for transportation are very case-specific. It should also be kept in mind that these results are based on a solar PV lifespan of 30 years. This might be over-optimistic, because the relocation of manufacturing to China has been associated with a decrease in the quality of PV solar panels. 18
Research has shown that the percentage of defective or under-performing PV cells has risen substantially in recent years, which could have a negative influence on the lifespan of the average solar panel, decreasing its sustainability.
Energy Cannibalism
Solar PV electricity remains less carbon-intensive than conventional grid electricity, even when solar cells are manufactured in China and installed in countries with relatively low solar insolation. This seems to suggest that solar PV remains a good choice no matter where the panels are produced or installed.
However, if we take into account the growth of the industry, the energy and carbon balance can quickly turn negative. That’s because at high growth rates, the energy and CO2 savings made by the cumulative installed capacity of solar PV systems can be cancelled out by the energy use and CO2 emissions from the production of new installed capacity. 161920
At high growth rates, the energy and CO2 savings made by the cumulative installed capacity of solar PV systems can be cancelled out by the energy use and CO2 emissions from the production of new installed capacity
A life cycle analysis that takes into account the growth rate of solar PV is called a “dynamic” life cycle analysis, as opposed to a “static” LCA, which looks only at an individual solar PV system. The two factors that determine the outcome of a dynamic life cycle analysis are the growth rate on the one hand, and the embodied energy and carbon of the PV system on the other hand. If the growth rate or the embodied energy or carbon increases, so does the “erosion” or “cannibalization” of the energy and CO2 savings made due to the production of newly installed capacity. 16
For the deployment of solar PV systems to grow while remaining net greenhouse gas mitigators, they must grow at a rate slower than the inverse of their CO2 payback time. 19
For example, if the average energy and CO2 payback times of a solar PV system are four years and the industry grows at a rate of 25%, no net energy is produced and no greenhouse gas emissions are offset. 19 If the growth rate is higher than 25%, the aggregate of solar PV systems actually becomes a net CO2 and energy sink. In this scenario, the industry expands so fast that the energy savings and GHG emissions prevented by solar PV systems are negated to fabricate the next wave of solar PV systems. 20
The CO2 Balance of Solar PV
Several studies have undertaken a dynamic life cycle analysis of renewable energy technologies. The results — which are valid for the period between 1998 and 2008 — are very sobering for those that have put their hopes on the carbon mitigation potential of solar PV power. A 2009 paper, which takes into account the geographical distribution of global solar PV installations, sets the maximum sustainable annual growth rate at 23%, while the actual average annual growth rate of solar PV between 1998 and 2008 was 40%. 1621
This means that the net CO2 balance of solar PV was negative for the period 1998-2008. Solar PV power was growing too fast to be sustainable, and the aggregate of solar panels actually increased GHG emissions and energy use. According to the paper, the net CO2 emissions of the solar PV industry during those 10 years accounted to 800,000 tonnes of CO2. 16 These figures take into account the fact that, as a consequence of a cleaner grid and better manufacturing processes, the production of solar PV panels becomes more energy efficient and less carbon-intensive over time.
Between 2009 and 2014, solar PV grew four times too fast to be sustainable
The sustainability of solar PV has further deteriorated since 2008. On the one hand, industry growth rates have accelerated. Solar PV grew on average by 59% per year between 2008 and 2014, compared to an annual growth rate of 40% between 1998 and 2008. 5
On the other hand, manufacturing has become more carbon-intensive. For its calculations of the CO2 balance in 2008, the study discussed above considers the carbon intensity of production worldwide to be 500 gCO2e/kWh. In 2013, with 87% of the production in Asia, this number had risen to about 950 gCO2e/kWh, which halves the maximum sustainable growth rate to about 12%.
If we also take into account the changes in geographic distribution of solar panels, with an increasing percentage installed in regions with higher solar insolation, the maximum sustainable growth rate increases to about 16%. 2223
Although more recent research is not available, it’s obvious that the CO2 emissions of the solar PV industry have further increased during the period 2009-2014. If we would consider all solar panels in the world as one large energy generating plant, it would not have generated any net energy or CO2-savings.
The Solution: Rethink the Manufacture and Use of Solar PV
Obviously, the net CO2 balance of solar PV could be improved by limiting the growth of the industry, but that would be undesirable. If we want solar PV to become important, it has to grow fast. Therefore, it’s much more interesting to focus on lowering the embodied energy of solar PV power systems, which automatically results in higher sustainable growth rates. The shorter the energy and CO2 payback times, the faster the industry can grow without becoming a net producer of CO2.
Embodied energy and CO2 will gradually decrease because of technological advances such as higher solar cell efficiencies and more efficient manufacturing techniques, and also as a consequence of the recycling of solar panels, which is not yet a reality. However, what matters most is where solar panels are manufactured, and where they are installed.
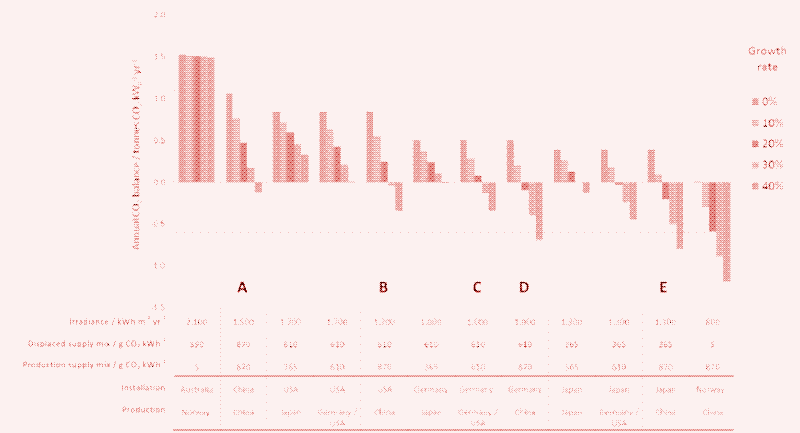
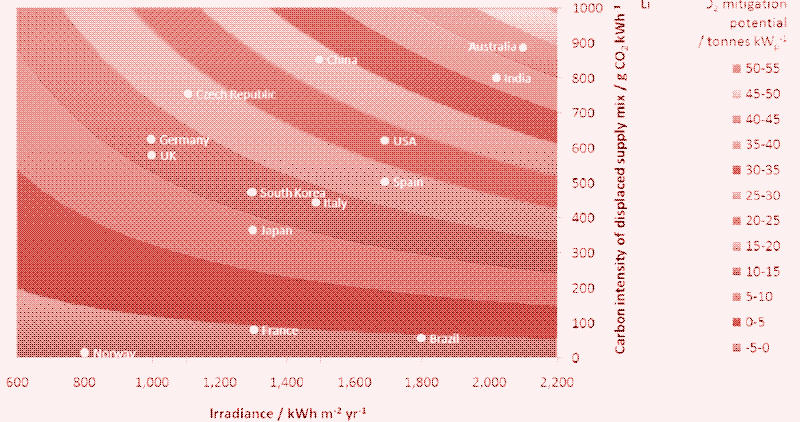
The location of production and installation is a decisive factor because there are three parameters in a life cycle analysis that are location dependent: the carbon intensity of the electricity used in production, the carbon intensity of the displaced electricity mix at the place of installation, and the solar insolation in the place of installation. 16
By carefully selecting the locations for production and installation we could improve the sustainability of solar PV power in a spectacular way. For PV modules produced in countries with low-carbon energy grids — such as France, Norway, Canada or Belgium — and installed in countries with high insolation and carbon-intensive grids — such as China, India, the Middle East or Australia — greenhouse gas emissions can be as low as 6-9 gCO2/kWh of generated electricity. 14151620 That’s 13 to 20 times less CO2 per kWh than solar PV cells manufactured in China and installed in Germany. 24
Sustainable growth rates of 300-460% are possible when PV modules are produced in countries with low-carbon energy grids and installed in countries with high insolation and carbon-intensive grids
This would allow sustainable growth rates of up to 300-460%, far above what’s even necessary. If solar PV would grow on average at a rate of 100% per year, it would take less than 10 years to meet today’s electricity’s demand. If it would grow at the 16% maximum sustainable growth rate we calculated above, meeting today’s electricity demand would take until 2045 — with no net CO2 savings. By that time, according to the forecasts, total global electricity demand will have more than doubled. 25
Of course, producing and installing solar panels in the right places implies international cooperation and a sound economic system, none of which exist. Manufacturing solar panels in Europe or the USA would also make them more expensive again, while many countries with the right conditions for solar don’t have the money to install them in large amounts.
An alternative solution is using on-site generation from renewables to meet a greater proportion of the electricity demand of PV manufacturing facilities — which can also happen in a country with a carbon-intensive grid. For example, if the electricity for the manufacturing of solar cells would be supplied by other solar cells, then the greenhouse emissions of solar PV systems could be reduced by 50-70%, depending on where they are produced (Europe or the USA). 7 In China, this decrease in CO2 emissions would even be greater.
In yet another scenario, we could dedicate nuclear plants exclusively to the manufacture of solar cells. Because nuclear is less carbon-intensive than PV solar, this sounds like the fastest, cheapest and easiest way to start producing a massive amount of solar cells without raising energy use and greenhouse emissions. But don’t underestimate the task ahead.
A 1 GW nuclear power plant can produce about 11 million square metres of solar panels per year, which corresponds to 1.66 GWp of solar power (based on the often cited average number of 150 w/m2). We would have needed 24 nuclear plants — or 1 in 20 atomic plants worldwide — working full-time to produce the solar panels manufactured in 2013. 26
What About Storage?
Why does the production of solar PV requires so much energy? Because the low power density — several orders of magnitude below fossil fuels — and the intermittency of solar power require a much larger energy infrastructure than fossil fuels do. It’s important to realize that the intermittency of solar power is not taken into account in our analysis. Solar power is not always available, which means that we need a backup-source of power or a storage system to jump in when the need is there. This component is usually not considered in LCAs of solar PV, even though it has a large influence on the sustainability of solar power.
Storage is no longer an academic question because several manufacturers — most notably Tesla — are pushing lithium-ion battery storage as an alternative for a grid-connected solar PV system. Lithium-ion batteries are more compact and technically superior to the lead-acid batteries commonly used in off-grid solar systems. Furthermore, the disincentivation of grid-connected solar systems in a growing number of countries makes off-grid systems more attractive.
In the next article, we investigate the sustainability of a PV-system with a lithium-ion battery. Meanwhile, enjoy the sun and stay tuned.
Reactions
To make a comment, please send an e-mail to solar (at) lowtechmagazine (dot) com. Your e-mail address is not used for other purposes, and will be deleted after the comment is published. If you don’t want your real name to be published, sign the e-mail with the name you want to appear.
Reactions
John Weber
All the things in our world have an industrial history. Behind the computer, the T-shirt, the vacuum cleaner is an industrial infrastructure fired by energy (fossil fuels mainly). Each component of our car or refrigerator has an industrial history. Mainly unseen and out of mind, this global industrial infrastructure touches every aspect of our lives. It pervades our daily living from the articles it produces, to its effect on the economy and employment, as well as its effects on the environment.
Solar energy collecting devices also have an industrial history. It is important to understand the industrial infrastructure and the environmental results for the components of the solar energy collecting devices so we don’t designate them with false labels such as green, renewable or sustainable.
This is an essay challenging ‘business as usual’. If we teach people that these solar devices are the future of energy without teaching the whole system, we mislead, misinform and create false hopes and beliefs.
Provided by the various industries themselves, I have provided both charts and videos for the solar cells, modules, aluminum from ore, aluminum from recycling, aluminum extrusion, inverters, batteries and copper.
Please note each piece of machinery you see in each of the videos has its own
industrial interconnection and history.
http://sunweber.blogspot.com/2015/04/solar-devices-industrial-infrastructure.html
Ray Orb
One factor which is rarely considered is if the solar panels are placed on a roof, how much additional cost is placed on the homeowner for roof repairs or a new roof?? This article is one of the best I’ve read.
Thomas
Hello,
Thanks for this article;
One question though: has end-of-life phasis been considered in the LCA? Are recycling process available for PV cells and, if exists, how much energy- and carbon-intensive are they, compared to production?
eds
Efficiency! People who use solar are aware of efficiency and use less energy, not more
. . . Using Less:
. . . . . . LED’s,
. . . . . . Insulation,
. . . . . . Energy Star Appliances,
. . . . . . Ceiling Fans,
Centralized Fossil Fuel!
https://flowcharts.llnl.gov/content/assets/images/energy/us/Energy_US_2013.png
. . . over 50% of the energy generated, is not used and causes pollution.
. . . Uses large amounts of Water
. . . Large amount of capital spent on building and maintaining “Poles & Wires.”
Distributed Solar & Storage
http://www.detail.de/architektur/themen/stromspeicher-fuers-haus-zukunftstechnologie-oder-geldverschwendung-021480.html
. . . Solar saves 30%, and
. . . Solar with storage saves 60%,
. . . (Zero Water Usage, no maintenance, no pollution = Energy/Water Nexus)
Norris Thomlinson
Besides the energy payback time, and the end-of-life disposal Thomas brought up, it’s important to recognize that solar panels and other “green technology” still require mining, an inherently destructive process: always ecocidal, and often genocidal. We can’t honestly term these technologies “sustainable.”
Green Technology & Renewable Energy FAQs:
http://deepgreenresistance.org/who-we-are/faqs/green-technology-renewable-energy
p droege
this is an unfortunate article. it reiterates many old misconception spun by the fossil fuel lobby. good is the observation that local and regional applications are preferable over global ones. but seen in a historical perspective it is irrelevant where solar is produced: it has to be produced and applied everywhere. and the comparisons with nat gas or nuclear are misleading: solar has no resource cost. and all energy forms require storage, also oil, coal and uranium: that vast infrastructure is ignored. also, the proposed solutions won’t work in a market economy etc. but the most important aspect is: as soon as we move to 50 and 100% the fossil content decreases. forever. the sun sends us no bills.
Kris De Decker
@ Thierry
Great link, thanks !
Jason Olshefsky
I hope you will address the costs of lithium versus lead when discussing Li-Ion battery storage in a future essay. My broad understanding is that acquiring lithium is environmentally intensive and occurs in areas where labor exploitation is likely. It’s not like I’m a proponent of lead, but—at least in the U.S.—there is a reasonably robust infrastructure for recycling and recovery.
Bart Hawkins Kreps
There are many good points in this article, which cast recent gains by photovoltaics in a more realistic light.
However the discussion of sustainable growth rate for PV seems somewhat misguided (unless I have misunderstood this discussion). On the one hand, if PV manufacturing were to increase by 1000% annually for five years, it is true that during those 5 years the manufacturing would emit more carbon than was saved by the operation of the panels in the same years. But is that really significant? In this hypothetical case, if after those 5 years, production of PVs suddenly stopped, wouldn’t the ongoing carbon emission savings more than make up for the temporary “excess” of carbon emissions during the manufacturing years?
Steve
“This might mean that the net CO2-balance never becomes positive, because solar panels have to be replaced every 30 years at best.”
This statement doesn’t seem to be based in reality. Most solar panels have warranties of at least 25 years, if not 30 years. And existing solar panels have shown they have a longevity well beyond their warranty period and should easily last beyond 50-years.
The first array I installed on my office in 2007 has only seen a 3% reduction in output over the first 8 years of operation. At that rate of output decline, they’ll still be producing 75% of their nameplate capacity 50 years from now. I expect them to last beyond my own lifetime and still be functional for my unborn childrens’ lifetimes.
Sam Gardner
The article raises very good points, but I would like to disagree with the presentations of “energy cannibalism”
We are dealing with an old accounting principle we call “investment”. In finance: Any company investing will use temporarily more money than they earn. They gather capital or take a loan to pay for it. In a stable country, these payments, loans, are spread over many years, for this kind of investments, 10 years or more are acceptable.
The same should be done with energy accounting. If we would look at the energy balance, not in the first 3 years of installation, but over the life cycle.
The situation we are facing is an emergency. We have a certain amount of money, a carbon ceiling we should not pass and a certain amount of time. How fast can we bring our carbon emissions down forever? The price of the solar panels is here a real issue for getting there. As solar panel production is low in labor, and high in energy, It must be possible to compete with China on this.
Most solar panels are installed nowadays in China itself,so local production makes sense.China installs also more renewables than any other country in the world.
However, the energy use in the production in China should rather be addressed by a carbon tax than by moving production to the rich north and shipping the panels to China.
Thierry
Situation is even worse if you consider all the factors to install and maintain solar panels. According to the study “Spain’s Photovoltaic Revolution. The Energy Return on Investment”, by Pedro Prieto and Charles Hall (Springer, 2013) , EROI of PV in Spain is less than 3:1.
For a review of the book, reference information and interesting comments from the author, read: http://energyskeptic.com/2015/tilting-at-windmills-spains-solar-pv/
Matthias
Location is key to the succes of photovoltaic electricity.
For example some sites in the Swiss alps have the same insulation like in southern Spain. At high altitudes the solar panels will be higher than most clouds. Means there are more hours of sunshine. The atmosphere is thinner and thus blocks less radiation. Additionally colder temperatures means that the PV cells are more efficient.
And the biggest benefits is that there are already a lot of big hydroelectric power station in the Alps, the largest produce more than 1 GW of electricity. And that is a Gigawatt which can be turned on or off and regulated instantly.
It will be more efficient to place PV array near hydro power stations since teh energy can be stored at site and all the transmission lines are there already. Even the lakes could be coverd with swimming PV cells. Those are artificial lakes so enviromental impact is lowered.
In other countries solar power can be used for a recerse osmosis process. No electricity need to be stored just the freshwater in cheap an efficient reservoirs. Or solar energy can used to power air conditioners. Again surplus energy could be used to produce ice. The ice storage will be much cheaper than a battery storage.
Sure there are many application which need a battery storage but with clever engineering a lot of energy could be stored by other needs and off load the batteries considerable.
MrColdWaterOfRealityMan
Solar panels are not the only source of solar power. Mirrors lenses, pipes and molten salt are both usable and sustainable. Admittedly less efficient, power systems based on these technologies are far more sustainable than the high tech processes needed for solar panel manufacture.
Zanstel
I don’t see the point over CO2 emissions. Because Solar is one of the best technologies we ever had, if we deploy solar slower, more CO2 will be emitted.
Of course more CO2 related to solar will be emitted as faster you deploy it, but what would happen if solar don’t deploy?
Other dirtier energy sources will be used, and the CO2 “saved” by not build more PV will be spended in greater numbers on other energy sources.
Jamie
Energy East pipeline advertisement by petroleum lobby group in prominent position at top of this story…“good for the economy and safe for the environment” apparently according to their ad…I dont agree with their assessment of pipeline risks to environment, and the ad offends me…just thought Id let you know ;)
Dairokkan
to: MrColdWaterOfRealityMan
Not necessary, efficiency of steam trubine and alternator, so it means Turbo-alternator can be over 40%, PV cells have usually between 18-30%. If we will count that thermal collectors has efficiency of 80%, then efficiency of thermal system can be 32% with possibility of cheap energy storage (compared to batteries) and reserve heating by natural gas or heating oil. Atmospheric burning is more ecological than combustion engines.
to: Matthias
You have point, but I somehow, can not imagine that people in Switzerland will let cover their meadows and mountains in solar cells. Even when idea of Matterhorn covered in blue cells is interesting, it is not highly probable. They are not that kind of country which will export it’s nature, they have cheap electricity from water, bit from nuclear
In my opinion we should focus on wind and water rather than on solar power. Development and research should be done on plants under 1MW and how gather energy of unstable wind near surface. Undoubtedly it will need dynamo or at least alternator rectifier and inverter in both cases. Because of stability which is not great production will suffer from fluctuation its something power companies don’t lake. One or ten kW’s are not problem, but hundreds can blow fuses on lines, that can result in serious loses in industrial processes like glass production or ceramic production. Those furnaces today depends on electricity and every outage can result into damages. So some kind of small accumulator will be necessary. Mechanical can be good solution because it’s low looses compared to electrical. I estimate that to generator will go 96% of initial power of prime mover in case of mechanical accumulator (we talk about accumulator which will last minutes)in case of electrical we will lose 15-20% of energy. That is not good and batteries will suffer from often re- and dis. charging. And mechanical accumulator will last for decades, chemical for years.
Ben
I really wish edison or Nicke Iron batteries were covered in this analysis. I find it to be a better choice then Lithium Ion batteries and lead acid. They have better charging characteristics and indefinite life times with with the addition of fresh water and catalyst every couple of decades.
I think Tesla is wrong to push Lithium Ion batteries for the home. Nickel Iron makes more sense in stationary home applications because of their durability.
Finally Jay Leno’s Edison electric car is still using it’s original batteries.
teslark
current level technology in solar is just the beginning. moving forward there will be revolutions in 1) efficiency 2) cost of maintanance (variable cost) 3) lifetime 4) cost of production.
consider leaves are 1% solar efficient and green plant life has taken over the oceans and entire planet.
it is all about the underlying technology.
that said, current level solar technology cannot sustain an energy revolution. as advanced as we are, we are still so completely backwards that you could eliminate ALL current solar commercial units and we’d be completely ok with relying on coal and existing tech.
current solar simply is a bridge to the next level technologies . deploying current solar technology is a necessary industrial exercise. without it, we would not learn the necessary lessons required to get information about the directions we must invest in for technological solar technology creation and deployment. the feedback loops of industrial buildout and r&D are inextricably linked.
so even though what we are doing now is insufficient is is entirely necessary and arguable we need to do more of this, even if it seems like a total waste of money now.
don’t forget ALL investment necessitates risk, otherwise, it’s not investment, it’s arbitrage or scalping.
Robin Perrett
We should be looking at what ‘Solar Windows Technologies, Inc. are about to bring into the market place, with coverings for window glass that develops electricity from light as well as sun, & out-produces the conventional solar panel. Installation costs are reputed to be recoverable within a year. (solarwindow.com)
kris de decker
I have rewritten the title and introduction to better reflect the contents of the article.
The earlier title was “How sustainable is solar PV power?”
sheila chambers
“Green renewables” that use NON renewable resources are NOT renewable!
Solar panels need raw material made from OIL, there other raw materials are mined using HUGE oil burning machines, they are made by burning OIL, coal & natural gas for energy, they are assembled in factories using huge amounts of energy produced by burning fossil fuels, they are shipped across the pacific in ships burning dirty bunker oil.
They are not “green”, they are not “renewable” & “sustainable growth” is a oxymoron.
We get massive amounts of raw materials from fossil resources that provide us with synthetic fibers, MEDICINES, paints, FERTILIZERS, pesticides, herbicides, FOOD, PLASTICS, we literally eat" OIL.
For every calorie of food we eat, TEN calories of OIL were burned!
Most of us would not even exist without OIL & after oil, most of us won’t be existing as our excessive population will collapse.
NONE of those “renewables” can produce any of the raw materials we currently get from fossil resources.
So even if you have solar panels, inverter, voltage converter & many batteries to store that energy, you may still have the lights on but you will still be starving to death along with most of the rest of humanity.
Then there is climate change that is already causing a decline in our food production but that’s another story.
Icarus
I like that you’re giving a skeptical look to solar boosterism, but Bart is right that there’s a key error here. Your analysis shows that over the long term, any form of solar PV leads to a net reduction in carbon emission. That is the main answer to your question of whether solar PV is sustainable (in terms of its effect on climate).
In your introduction, you wrote, “solar PV has actually increased energy use and greenhouse gas emissions instead of lowering them.” That is misleading. It really doesn’t matter what the emissions are just over the past few years—it matters what the emissions will be over the life of PV cells that are being produced. That is a settled question; producing and installing PV cells is sustainable. It’s not a problem that PV production has been increasing so rapidly—it’s a boon to climate.
I agree that there is a deeper question about how best to use PV cells, and your conclusion on that count makes sense: it would be better if the panels were produced more efficiently. (Though that does raise the question of what would be done with the coal plants that are currently providing power to produce solar cells. If solar cells were made in more efficient places, would the coal plants just be used to power other processes? In that case, it’s not clear that moving the PV production would actually make a difference.)
Michael
It’s mentioned that solar actually creates more carbon if it grows beyond a certain rate, but wouldn’t we assume that the more growth, the better as long as it’s replacing more carbon-intensive sources? Do we know how much of solar production is replacing or diminishing use of such sources vs just adding more power capacity to the grid?
George Elliot
Here is a recent comparative LCA published in journal Clean Technologies and Environmental Policy that asks the same question: how do CO2e and energy payback periods change depending on where PV panels are manufactured and installed?
https://link.springer.com/article/10.1007/s10098-019-01776-z
They find similar results as the 2014 study you cite here.
John Somdecerff
Sounds like somebody listened: https://ultralowcarbonsolar.org/