Our self-hosted, solar-powered, off-grid website has been running for 15 months now. In this article, we present its energy and uptime data, and calculate the embodied energy of our configuration. Based on these results, we consider the optimal balance between sustainability and server uptime, and outline possible improvements.
Uptime, electricity use, system efficiency
What’s the optimal balance between uptime and sustainability?
Embodied energy of different sizes of solar panels and batteries
CO2-emissions: how sustainable is a solar powered website?
Energy use of our website throughout the internet
Introduction
In September 2018, Low-tech Magazine launched a new website that aimed to radically reduce the energy use and carbon emissions associated with accessing its content. Internet energy use is growing quickly on account of both increasing bit rates (online content gets “heavier”) and increased time spent online (especially since the arrival of mobile computing and wireless internet).
The solar powered website bucks against these trends. To drop energy use far below that of the average website, we opted for a back-to-basics web design, using a static website instead of a database driven content management system. To reduce the energy use associated with the production of the solar panel and the battery, we chose a minimal set-up and accepted that the website goes off-line when the weather is bad.
Uptime, Electricity Use & System Efficiency
Uptime
The solar powered website goes off-line when the weather is bad – but how often does that happen? For a period of about one year (351 days, from 12 December 2018 to 28 November 2019), we achieved an uptime of 95.26%. This means that we were off-line due to bad weather for 399 hours.
If we ignore the last two months, our uptime was 98.2%, with a downtime of only 152 hours. Uptime plummeted to 80% during the last two months, when a software upgrade increased the energy use of the server. This knocked the website off-line for at least a few hours every night.
Electricity Use and System Efficiency
Let’s have a look at the electricity used by our web server (the “operational” energy use). We have measurements from the server and from the solar charge controller. Comparing both values reveals the inefficiencies in the system. Over a period of roughly one year (from 3 December 2018 to 24 November 2019), the electricity use of our server was 9.53 kilowatt-hours (kWh).
We measured significant losses in the solar PV system due to voltage conversions and charge/discharge losses in the battery. The solar charge controller showed a yearly electricity use of 18.10 kWh, meaning that system efficiency was roughly 50%.
Energy Use per Unique Visitor
During the period under study, the solar powered website received 865,000 unique visitors. Including all energy losses in the solar set-up, electricity use per unique visitor is then 0.021 watt-hour.
One kilowatt-hour of solar generated electricity can thus serve almost 50,000 unique visitors, and one watt-hour of electricity can serve roughly 50 unique visitors. This is all renewable energy and as such there are no direct associated carbon emissions.
One kilowatt-hour of solar generated electricity can serve almost 50,000 unique visitors
Embodied Energy Use & Uptime
The story often ends here when renewable energy is presented as a solution for the growing energy use of the internet. When researchers examine the energy use of data centers, which host the content that is accessible on the internet, they never take into account the energy that is required to build and maintain the infrastructure that powers those data centers.
There is no such omission with a self-hosted website powered by an off-the-grid solar PV installation. The solar panel, the battery, and the solar charge controller are equally essential parts of the installation as the server itself. Consequently, energy use for the mining of the resources and the manufacture of these components – the “embodied energy” – must also be taken into account.
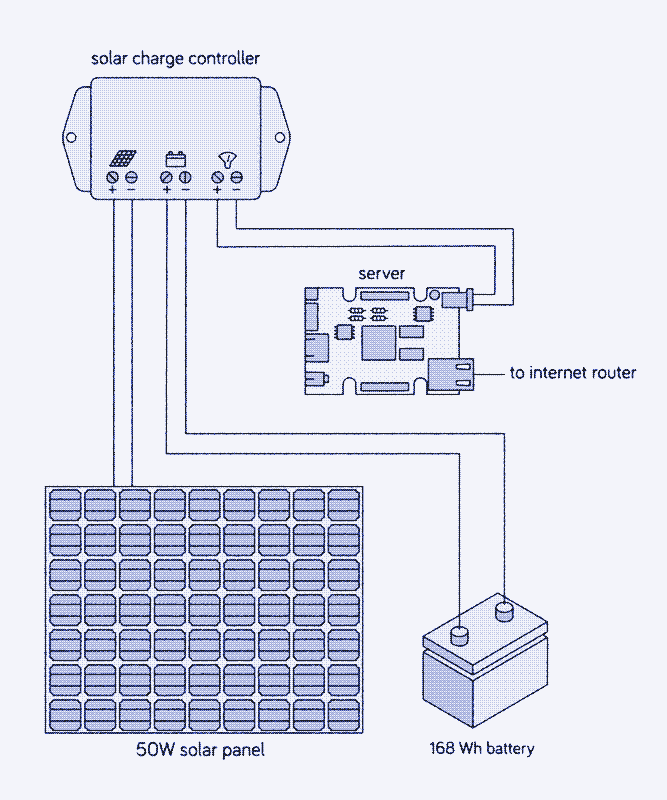
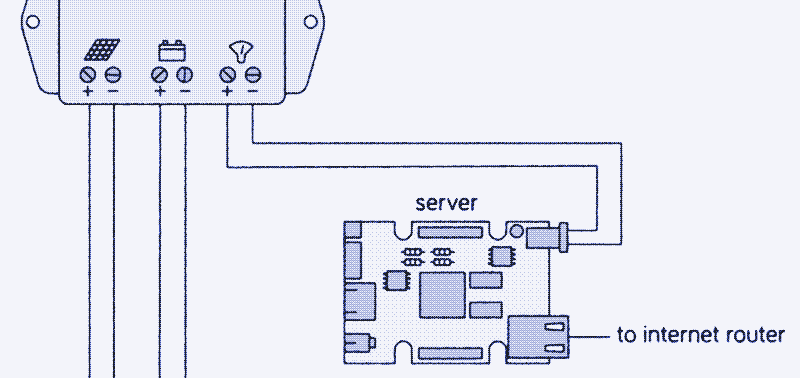
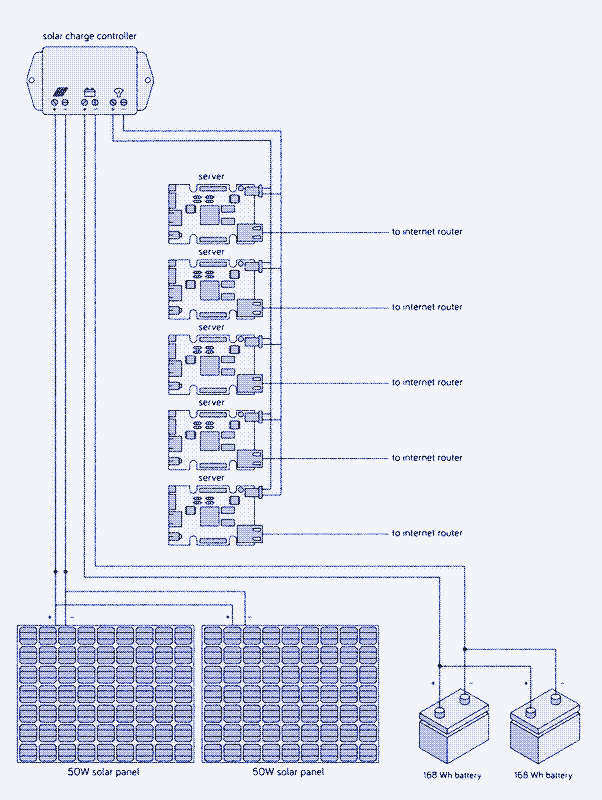
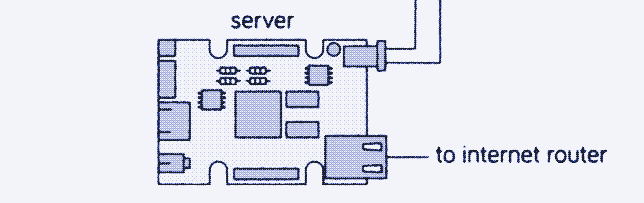
A simple representation of our system. The voltage conversion (between the 12V charge controller and the 5V server) and the battery meter (between the server and the battery) are missing. Unfortunately, most of this energy comes from fossil fuels, either in the form of diesel (mining the raw materials and transporting the components) or in the form of electricity generated mainly by fossil fuel power plants (most manufacturing processes).
The sizing of battery and solar panel is a compromise between uptime and sustainability
The embodied energy of our configuration is mainly determined by the size of the battery and the solar panel. At the same time, the size of battery and solar panel determine how often the website will be online (the “uptime”). Consequently, the sizing of battery and solar panel is a compromise between uptime and sustainability.
To find the optimal balance, we have run (and keep running) our system with different combinations of solar panels and batteries. Uptime and embodied energy are also determined by the local weather conditions, so the results we present here are only valid for our location (the balcony of the author’s home near Barcelona, Spain).
Uptime and Battery size
Battery storage capacity determines how long the website can run without a supply of solar power. A minimum of energy storage is required to get through the night, while additional storage can compensate for a certain period of low (or no) solar power production during the day. Batteries deteriorate with age, so it’s best to start with more capacity than is actually needed, otherwise the battery needs to be replaced rather quickly.
> 90% Uptime
First, let’s calculate the minimum energy storage needed to keep the website online during the night, provided that the weather is good, the battery is new, and the solar panel is large enough to charge the battery completely. The average power use of our web server during the first year, including all energy losses in the solar installation, was 1.97 watts. During the shortest night of the year (8h50, June 21), we need 17.40 watt-hour of storage capacity, and during the longest night of the year (14h49, December 21), we need 29.19 Wh.
Minimum energy storage required to keep the website online during the night*
| Month | Daylight | Night | Storage |
|---|---|---|---|
| 21 Sep 2018 | 12h13min | 11h47min | 23.21 Wh |
| 21 Oct 2018 | 10h52min | 13h8min | 25.87 Wh |
| 21 Nov 2018 | 9h41min | 14h19min | 28.2 Wh |
| 21 Dec 2018 | 9h11min | 14h49min | 29.1 Wh |
| 21 Jan 2019 | 9h41min | 14h19min | 28.2 Wh |
| 21 Feb 2019 | 10h53min | 13h7min | 25.84 Wh |
| 21 Mar 2019 | 12h13min | 11h47min | 23.22 Wh |
| 21 Apr 2019 | 13h34min | 10h26min | 20.55 Wh |
| 21 May 2019 | 14h41min | 9h19min | 18.35 Wh |
| 21 Jun 2019 | 15h10min | 8h50min | 17.4 Wh |
| 21 Jul 2019 | 14h43min | 9h17min | 18.29 Wh |
| 21 Aug 2019 | 13h36min | 10h24min | 20.49 Wh |
- Location: Barcelona
- Provided that the weather is sunny
- Wh = Watt-hours
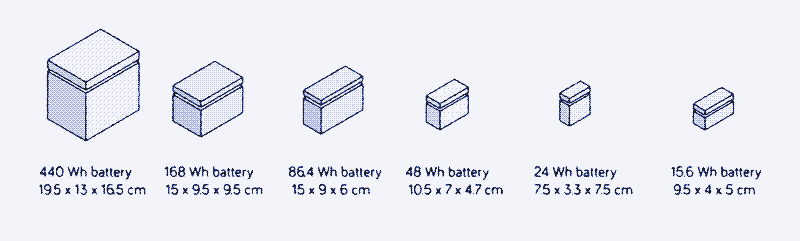
Because lead-acid batteries should not be discharged below half of their capacity, the solar powered server requires a 60 Wh lead-acid battery to get through the shortest nights when solar conditions are optimal (2 x 29.19Wh). For most of the year we ran the system with a slightly larger energy storage (up to 86.4 Wh) and a 50W solar panel, and achieved the above mentioned uptime of 95-98%.1
100% Uptime
A larger battery would keep the website running even during longer periods of bad weather, again provided that the solar panel is large enough to charge the battery completely. To compensate for each day of very bad weather (no significant power production), we need 47.28 watt-hour (24h x 1.97 watts) of storage capacity.
From 1 December 2019 to 12 January 2020, we combined the 50 W solar panel with a 168 watt-hour battery, which has a practical storage capacity of 84 watt-hour. This is enough storage to keep the website running for two nights and a day. Even though we tested this configuration during the darkest period of the year, we had relatively nice weather and achieved an uptime of 100%.
However, to assure an uptime of 100% over a period of years would require more energy storage. To keep the website online during four days of low or no power production, we would need a 440 watt-hour lead-acid battery – the size of a car battery. We include this configuration to represent the conventional approach to off-grid solar power.
< 90% Uptime
We also made calculations for batteries that aren’t large enough to get the website through the shortest night of the year: 48 Wh, 24 Wh, and 15.6 Wh (with practical storage capacities of 24 Wh, 12 Wh, and 7.8 Wh, respectively). The latter is the smallest lead-acid battery commercially available.
A website that goes off-line in evening could be an interesting option for a local online publication with low anticipated traffic after midnight.
If the weather is good, the 48 Wh lead-acid battery will keep the server running during the night from March to September. The 24 Wh lead acid-battery can keep the website online for a maximum of 6 hours, meaning that the server will go off-line each night of the year, although at different hours depending on the season.
Finally, the 15.6 Wh battery keeps the website online for only four hours when there’s no solar power. Even if the weather is good, the server will stop working around 1 am in summer and around 9 pm in winter. The maximum uptime for the smallest battery would be around 50%, and in practice it will be lower due to clouds and rain.
A website that goes off-line in evening could be an interesting option for a local online publication with low anticipated traffic after midnight. However, since Low-tech Magazine’s readership is almost equally divided between Europe and the USA this is not an attractive option. If the website goes down every night, our American readers could only access it during the morning.
Expected uptimes by battery type on a full charge.
| Battery | Uptime |
|---|---|
| 440Wh | Website gets through 4 days of bad weather |
| 168Wh | Website gets through 1 day of bad weather |
| 86.4Wh | Website gets through the night if the weather is good |
| 48Wh | Website goes offline many nights of the year |
| 24Wh | Website goes offline every night |
| 15.6Wh | Website goes offline every night |
Uptime and Solar Panel Size
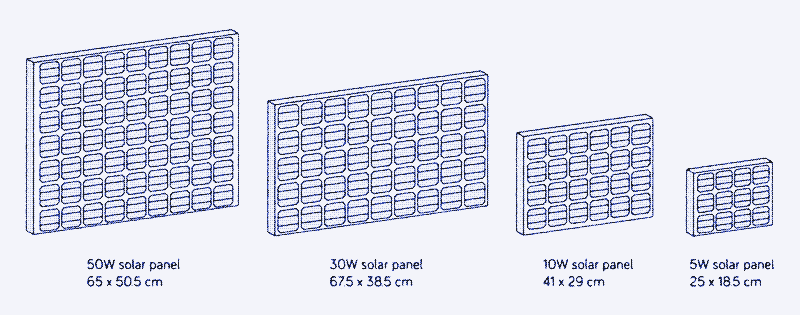
The uptime of the solar powered website is not only determined by the battery, but also by the solar panel, especially in relation to bad weather. The larger the solar panel, the quicker it will charge the battery and fewer hours of sun will be needed to get the website through the night. For example, with the 50 W solar panel, one to two hours of full sun are sufficient to completely charge most of the batteries.
Replace the 50 W solar panel by a 10 W solar panel, however, and the system needs at least 5.5 hours to charge the 86.4 Wh battery in optimal conditions (2 W to operate the server, 8 W to charge the battery). If the 10W solar panel is combined with a larger, 168 Wh lead-acid battery, it needs 10.5 hours of full sun to charge the battery completely, which is only possible from February to November.
Clouds
A larger solar panel is equally advantageous during cloudy weather. Clouds can lower solar energy production to anywhere between 0 and 90% of maximum capacity, depending on the thickness of cloud cover. If a 50 watt solar panel produces just 10% of its maximum capacity (5W), that’s still enough to run the server (2W) and charge the battery (3W).
However, if a 10 W solar panel only produces 10% of its capacity, that’s just enough to power the server, and the battery won’t be charged. We ran the website on a 10 W panel from 12 to 21 January 2020, and it quickly went down when the weather was not optimal. We are now powering the website with a 30W solar panel (and a 168 Wh battery).
A larger solar panel increases the chances that the website remains online even when weather conditions are not optimal.
A 5 W solar panel – the smallest 12V solar panel commercially available – is the absolute minimum required to run a solar powered website. However, only under optimal conditions will it be able to power the server (2W) and charge the battery (3W), and it could only keep the website running through the night if the day is long enough. Because solar panels rarely generate their maximum power capacity, this would result in a website that is online only while the sun shines.
Even though the combination of a small solar panel and large battery can have the same embodied energy as the combination of a large solar panel and a small battery, the system each creates will have very different characteristics. In general, it’s best to opt for a larger solar panel and a smaller battery, because this combination increases the life expectancy of the battery – lead-acid batteries need to be fully charged from time to time or they lose storage capacity.
Embodied Energy for Different Sizes of Batteries and Solar Panels
It takes 1.03 megajoule (MJ) to produce 1 watt-hour of lead-acid battery capacity2, and 3,514 MJ of energy to produce one m2 of solar panel.3 In the table below, we present the embodied energy for different sizes of batteries and solar panels and then calculate the embodied energy per year, based on a life expectancy of 5 years for batteries and 25 years for solar panels. The values are converted to kilowatt-hours per year and refer to primary energy, not electricity.
A solar powered website also needs a charge controller and of course a web server. The embodied energy for these components remains the same no matter the size of solar panel or battery. The embodied energy per year is based on a life expectancy of 10 years. 45
Embodied Energy of Different Components (per year of operation)
| Battery* | Embodied Energy |
|---|---|
| 440Wh battery | 25.17 kWh/year |
| 168Wh battery | 9.60 kWh/year |
| 86.4Wh battery | 3.91 kWh/year |
| 48Wh battery | 2.75 kWh/year |
| 24Wh battery | 1.27 kWh/year |
| 15.6Wh battery | 0.89 kWh/year |
- Calculated on a life expectancy of 5 years
- kWh/year = primary energy
| Solar Panel* | Embodied Energy |
|---|---|
| 50W solar panel | 16.96 kWh/year |
| 30W solar panel | 10.20 kWh/year |
| 10W solar panel | 3.40 kWh/year |
| 5W solar panel | 1.70 kWh/year |
- Calculated on a life expectancy of 25 years
- kWh/year = primary energy
| Other Components* | Embodied Energy |
|---|---|
| Solar charge controller | 3.33 kWh/year |
| Server | 5.00 kWh/year |
- Calculated on a life expectancy of 10 years
- kWh/year = primary energy
We now have all data to calculate the total embodied energy for each combination of solar panels and batteries. The results are presented in the table below. The embodied energy varies by a factor of five depending on the configuration: from 10.92 kWh primary energy per year for the combination of the smallest solar panel (5W) with the smallest battery (15.6 Wh) to 50.46 kWh primary energy per year for the combination of the largest solar panel (50 W) with the largest battery (440Wh).
Embodied energy per year for different solar set-ups*
| Solar Panel | ||||
| Battery | 50W | 30W | 10W | 5W |
|---|---|---|---|---|
| 440Wh | 50.46 kWh | 43.70 kWh | n/a | n/a |
| 168Wh | 34.89 kWh | 28.13 kWh | 21.33 kWh | n/a |
| 86.4Wh | 29.20 kWh | 22.36 kWh | 15.64 kWh | 13.94 kWh |
| 48Wh | 28.04 kWh | 21.28 kWh | 14.18 kWh | 12.78 kWh |
| 24Wh | 26.29 kWh | 19.80 kWh | 13.00 kWh | 11.30 kWh |
| 15.6Wh | 26.18 kWh | 19.42 kWh | 12.62 kWh | 10.92 kWh |
- Includes embodied energy of the server and charge controller
- kWh/year = primary energy
- n/a = solar panel cannot charge the battery completely, no matter the season.
If we divide these results by the number of unique visitors per year (865,000), we obtain the embodied energy use per unique visitor to our website. For our original configuration with 95-98% uptime (50W solar panel, 86.4Wh battery), primary energy use per unique visitor is 0.03 Wh. This result would be pretty similar for the other configurations with a lower uptime, because although the embodied energy is lower, so is the number of unique visitors.
Carbon Emissions: How Sustainable is the Solar Powered Website?
Carbon Emissions of the Solar Powered Website
Now that we have calculated the embodied energy of different configurations, we can calculate the carbon emissions. We can’t compare the environmental footprint of the solar powered website with that of the old website, because it is hosted elsewhere and we can’t measure its energy use. What we can compare is the solar powered website with a similar self-hosted configuration that is run on grid power. This allows us to assess the (un)sustainability of running the website on solar power.
Life cycle analyses of solar panels are not very useful for working out the CO2-emissions of our components because they work on the assumption that all energy produced by the panels is used. This is not necessarily true in our case: the larger solar panels waste a lot of solar power in optimal weather conditions.
Hosting the solar powered Low-tech Magazine for a year has produced as much emissions as an average car driving a distance of 50 km.
We therefore take another approach: we convert the embodied energy of our components to litres of oil (1 litre of oil is 10 kWh of primary energy) and calculate the result based on the CO2-emissions of oil (1 litre of oil produces 3 kg of greenhouse gasses, including mining and refining it). This takes into account that most solar panels and batteries are now produced in China – where the power grid is three times as carbon-intensive and 50% less energy efficient than in Europe. 6
This means that fossil fuel use associated with hosting the solar powered Low-tech Magazine during the first year (50W panel, 86.4 Wh battery) corresponds to 3 litres of oil and 9 kg of carbon emissions – as much as an average European car driving a distance of 50 km. Below are the results for the other configurations:
Embodied energy in oil equivalents (L / year) and carbon emissions (kg / year) for different solar setups*
| 50W | 30W | 10W | 5W | |
|---|---|---|---|---|
| 440Wh | 5.05 L 15.14 kg |
4.37 L 13.11 kg |
n/a | n/a |
| 168Wh | 3.49 L 10.47 kg |
2.81 L 8.44 kg |
2.13 L 6.40 kg |
n/a |
| 86.4Wh | 2.92 L 8.76 kg |
2.24 L 6.71 kg |
1.56 L 4.69 kg |
1.39 L 4.18 kg |
| 48Wh | 2.80 L 8.41 kg |
2.13 L 6.38 kg |
1.45 L 4.34 kg |
1.28 L 3.83 kg |
| 24Wh | 2.63 L 7.89 kg |
1.98 L 5.94 kg |
1.3 L 3.90 kg |
1.13 L 3.39 kg |
| 15.6Wh | 2.62 L 7.85 kg |
1.94 L 5.83 kg |
1.26 L 3.79 kg |
1.09 L 3.28 kg |
- Includes embodied energy of the server and charge controller
- n/a = solar panel cannot charge the battery completely, no matter the season.
Comparison with Carbon Intensity of Spanish Power Grid
Now let’s calculate the hypothetical CO2-emissions from running our self-hosted web server on grid power instead of solar power. CO2-emissions in this case depend on the Spanish power grid, which happens to be one of the least carbon intensive in Europe due to its high share of renewable and nuclear energy (respectively 36.8% and 22% in 2019).
Last year, the carbon intensity of the Spanish power grid decreased to 162g of CO2 per kWh of electricity. For comparison, the average carbon intensity in Europe is around 300g per kWh of electricity, while the carbon intensity of the US and Chinese power grid are respectively above 400g and 900g of CO2 per kWh of electricity.
If we just look at the operational energy use of our server, which was 9.53 kWh of electricity during the first year, running it on the Spanish power grid would have produced 1.54 kg of CO2-emissions, compared to 3 - 10 kg in our tested configurations. This seems to indicate that our solar powered server is a bad idea, because even the smallest solar panel with the smallest battery generates more carbon emissions than grid power.
When the carbon intensity of the power grid is measured, the embodied energy of the renewable power infrastructure is taken to be zero.
However, we’re comparing apples to oranges. We have calculated our emissions based on the embodied energy of our installation. When the carbon intensity of the Spanish power grid is measured, the embodied energy of the renewable power infrastructure is taken to be zero. If we calculated our carbon intensity in the same way, of course it would be zero, too.
Ignoring the embodied carbon emissions of the power infrastructure is reasonable when the grid is powered by fossil fuel power plants, because the carbon emissions to build that infrastructure are very small compared to the carbon emissions of the fuel that is burned. However, the reverse is true of renewable power sources, where operational carbon emissions are almost zero but carbon is emitted during the production of the power plants themselves.
To make a fair comparison with our solar powered server, the calculation of the carbon intensity of the Spanish power grid should take into account the emissions from the building and maintaining of the power plants, the transmission lines, and – should fossil fuel power plants eventually disappear – the energy storage. Of course, ultimately, the embodied energy of all these components would depend on the chosen uptime.
Possible Improvements
There are many ways in which the sustainability of our solar powered website could be improved while maintaining our present uptime. Producing solar panels and batteries using electricity from the Spanish grid would have the largest impact in terms of carbon emissions, because the carbon footprint of our configuration would be roughly 5 times lower than it is now.
What we can do ourselves is lower the operational energy use of the server and improve the system efficiency of the solar PV installation. Both would allow us to run the server with a smaller battery and solar panel, thereby reducing embodied energy. We could also switch to another type of energy storage or even another type of energy source.
Server
We already made some changes that have resulted in a lower operational energy use of the server. For example, we discovered that more than half of total data traffic on our server (6.63 of 11.16 TB) was caused by a single broken RSS implementation that pulled our feed every couple of minutes.
A difference in power use of 0.19 watts adds up to 4.56 watt-hour over the course of 24 hours, which means that the website can stay online for more than 2.5 hours longer.
Fixing this as well as some other changes lowered the power use of the server (excluding energy losses) from 1.14 watts to about 0.95 watts. The gain may seem small, but a difference in power use of 0.19 watts adds up to 4.56 watt-hour over the course of 24 hours, which means that the website can stay online for more than 2.5 hours longer.
System Efficiency
System efficiency was only 50% during the first year. Energy losses were experienced during charging and discharging of the battery (22%), as well as in the voltage conversion from 12V (solar PV system) to 5V (USB connection), where the losses add up to 28%. The initial voltage converter we built was pretty suboptimum (our solar charge controller doesn’t have a built-in USB-connection), so we could build a better one, or switch to a 5V solar PV set-up.
Energy Storage
To increase the efficiency of the energy storage, we could replace the lead-acid batteries with more expensive lithium-ion batteries, which have lower charge/discharge losses (<10%) and lower embodied energy. More likely is that we eventually switch to a more poetic small-scale compressed air energy storage system (CAES). Although low pressure CAES systems have similar efficiency to lead-acid batteries, they have much lower embodied energy due to their long life expectancy (decades instead of years).
Energy Source
Another way to lower the embodied energy is to switch renewable energy source. Solar PV power has high embodied energy compared to alternatives such as wind, water, or human power. These power sources could be harvested with little more than a generator and a voltage regulator – as the rest of the power plant could be built out of wood. Furthermore, a water-powered website wouldn’t require high-tech energy storage. If you’re in a cold climate, you could even operate a website on the heat of a wood stove, using a thermo-electric generator.
Solar Tracker
People who have a good supply of wind or water power could build a system with lower embodied energy than ours. However, unless the author starts powering his website by hand or foot, we’re pretty much stuck with solar power. The biggest improvement we could make is to add a solar tracker that makes the panel follow the sun, which could increase electricity generation by as much as 30%, and allow us to obtain a better uptime with a smaller panel.
Let’s Scale Things Up !
A final way to improve the sustainability of our system would be to scale it up: run more websites on a server, and run more (and larger) servers on a solar PV system. This set-up would have much lower embodied energy than an oversized system for each website alone.
Solar Webhosting Company
If we were to fill the author’s balcony with solar panels and start a solar powered webhosting company, the embodied energy per unique visitor would decrease significantly. We would need only one server for multiple websites, and only one solar charge controller for multiple solar panels. Voltage conversion would be more energy efficient, and both solar and battery power could be shared by all websites, which brings economies of scale.
Of course, this is the very concept of the data center, and although we have no ambition to start such a business, others could take this idea forward: towards a data center that is run just as efficiently as any other data center today, but which is powered by renewables and goes off-line when the weather is bad.
Add More Websites
We found that the capacity of our server is large enough to host more websites, so we already took a small step towards economies of scale by moving the Spanish and French versions of Low-tech Magazine to the solar powered server (as well as some other translations).
Although this move will increase our operational energy use and potentially also our embodied energy use, we also eliminate other websites that were hosted elsewhere. We also have to keep in mind that the number of unique visitors to Low-tech Magazine may grow in the future, so we need to become more energy efficient just to maintain our environmental footprint.
Combine Server and Lighting
Another way to achieve economies of scale would give a whole new twist to the idea. The solar powered server is part of the author’s household, which is also partly powered by off-grid solar energy. We could test different sizes of batteries and solar panels – simply swapping components between solar installations.
When we were running the server on the 50 W panel, the author was running the lights in the living room on a 10W panel – and was often left sitting in the dark. When we were running the server on the 10 W panel, it was the other way around: there was more light in the household, at the expense of a lower server uptime.
If the weather gets bad, the author could decide not to use the lights and keep the server online – or the other way around
Let’s say we run both the lights and the server on one solar PV system. It would lower the embodied energy if both systems are considered, because only one solar charge controller would be needed. Furthermore, it could result in a much smaller battery and solar panel (compared to two separate systems), because if the weather gets bad, the author could decide not to use the lights and keep the server online – or the other way around. This flexibility is not available now, because the server is the only load and its power use cannot be easily manipulated.
Energy Use in the Network
As far as we know, ours is the first life cycle analysis of a website that runs entirely on renewable energy and includes the embodied energy of its power and energy storage infrastructure. However, this is not, of course, the total energy use associated with this website.
There’s also the operational and embodied energy of the network infrastructure (which includes our router, the internet backbone, and the mobile phone network), and the operational and embodied energy of the devices that our visitors use to access our website: smartphones, tablets, laptops, desktops. Some of these have low operational energy use, but they all have very limited lifespans and thus high embodied energy.
Energy use in the network is directly related to the bit rate of the data traffic that runs through it, so our lightweight website is just as efficient in the communication network as it is on our server. However, we have very little influence over which devices people use to access our website, and the direct advantage of our design is much smaller here than in the network. For example, our website has the potential to increase the life expectancy of computers, because it’s light enough to be accessed with very old machines. Unfortunately, our website alone will not make people use their computers for longer.
Both the network infrastructure and the end-use devices could be re-imagined along the lines of the solar powered website.
That said, both the network infrastructure and the end-use devices could be re-imagined along the lines of the solar powered website – downscaled and powered by renewable energy sources with limited energy storage. Parts of the network infrastructure could go off-line if the local weather is bad, and your e-mail may be temporarily stored in a rainstorm 3.000 km away. This type of network infrastructure actually exists in some countries.
Because the total energy use of the internet is usually measured to be roughly equally distributed over servers, network, and end-use devices (all including the manufacturing of the devices), we can make a rough estimate of the total energy use of this website throughout a re-imagined internet. For our original set-up with 95.2% uptime, this would be 87.6 kWh of primary energy, which corresponds to 9 litres of oil and 27 kg of CO2 per year. The improvements we outlined earlier could bring these numbers further down, because in this calculation the whole internet is powered by oversized solar PV systems on balconies.
Thanks to Kathy Vanhout, Adriana Parra and Gauthier Roussilhe.
Reactions
To make a comment, please send an e-mail to solar (at) lowtechmagazine (dot) com. Your e-mail address is not used for other purposes, and will be deleted after the comment is published. If you don’t want your real name to be published, sign the e-mail with the name you want to appear.
Reactions
Will
Have you thought about hosting your notechmagazine website on the solar powered server alongside the translated websites, or is it too massive to run on the server at the moment?
Amos Blanton
There are many ways to imagine building more opportunities for efficiency into the design of the network protocol itself. For example, you could imagine routing requests to solar servers around the world who have agreed to mirror each others websites. The criteria used to select which server(s) to request content from could be how much sun is shining on them at the moment. That way servers with full sun and charged batteries could work hardest, making good use of power that would otherwise be wasted.
Dr. Edward Morbius
Kris:
Love your work and inspiration.
Looking over the solar-website retrospective (https://solar.lowtechmagazine.com/2020/01/how-sustainable-is-a-solar-powered-website.html), some thoughts. Hopefully not too much of this is already considered
Traffic and load aren’t mentioned. If the system is serving continuous requests, suspending or switching to a low-power / hibernation mode isn’t viable, but if it isn’t, then utilising a wake-on-demand service (wake-on-lan, inetd) might offer some server efficiencies.
System performance tuning. Ruthlessly pruning all unnecessary processing to match available power. Disabling cronjobs either at night or when power reserves are below a specified threshold might help somewhat.
Scheduled or batched jobs. RSS feeds especially might be slotted such that they’re served en mass at a specified interval. These tend to be automated (rather than human-initiated) requests, and if a combined burst of activity allows the system to return to quiet mode, might be worthwhile. Otherwise, RSS could also be disabled at night.
A router-based server-side cache. Move static pages/requests further off the webserver itself. Nginix or squid proxy?
Hardware-accelerated crypto / TLS termination. Either on the webserver or router – moving crypto to a dedicated hardware implementation might reduce processing load. Performance monitering should indicate if this is the case.
Detailed system power monitoring: This seems missing from the analysis. A breakdown of power usage by process / function would be interesting.
Geographically-distributed service. One obvious alternative to single-site provisioning would be to have a globally-distributed set of servers, possibly serving numerous websites, spread across both latitudes and north/south hemispheres. The likelihood of all instances being simultaneously power-starved is low. Even as few as 2-4 systems should provide considerable availability improvements. DNS load balancing (with some indication of “I’m going to sleep soon”) might be an approach. So long as this consolidates multiple websites, the overall embedded energy should remain feasible, and reliability enhancement should be much easier than trying to supply larger panels and/or battery storage.
Drew Pearce
I read with interest the analysis of the sustainability of the solar
powered website.
I wonder if you’ve considered demand shaping in different ways:
So something like targeted downtime. If you had data around when the
website is being accessed and there was a time which was very low access
rate then forcing downtime to safe the battery could allow you to use
the lower spec system with minimal experienced downtime. It reminded me
a little of your discussion around energy security and downtimes. Aiming
for 96% downtime would involve finding two blocks of 30 minutes in a 24
period (or four blocks of 15minutes) to decide the number of visitors is
small enough to warrant the downtime.
The other thing I was thinking about (but have very limited experience
of) is your website lends itself well to RSS style content access. I’m
not clear on the details of how RSS feeds work but I presume the content
is called when the users RSS feed calls for it. If there was a system to
communicate a time to attempt to access based on the power details of
your system. I think it would prob work best for content heavy websites
as I suspect the ratio of data used to probe the system to the data of
the content itself would need to be high to make it worthwhile. It seems
that a system which emailed new content out to a list of subscribers but
only did so when the sun was shining would also be potentially efficient
but is much more limited than a website.
Best,
Drew
Ikkaro
If you have enough and appropriate energy storage you could expand the system with a Stirling engine
Kris De Decker
Comments at hackernews: https://news.ycombinator.com/item?id=22184052
@ Will
Yes, No Tech Magazine will also move to the solar powered server.
@ Others
Thanks for the advice.
And a breakdown of power usage by process / function would indeed be interesting, we’re going to look into that.
@ Drew
Targeted downtime is a good idea, but due to our international readership there is never really a moment in the day with a very low access rate.
Markus Padourek
All very interesting comments that have been added so far and most of them I think are worth considering.
One point I find interesting to consider more in-depth is in regards to the location of the server and how much energy is required for the request to get from the user to the server, so e.g. now there is just one server in Barcelona serving requests from all the world, but mostly the US and Europe. So requests from the US now need more energy and have a higher embodied energy, because the bits have to travel further and more infrastructure is needed to serve each request. But if now there was also a server in the US serving the users from the US the total energy use of the requests would immediately reduce. Plus then it would not matter so much if each server-setup has some downtime at night-time and one could possibly use a smaller battery / weaker solar panel.
Of course this energy usage is very difficult to calculate accurately, as it is difficult to figure out what exact infrastructure is serving the requests and it probably would increase the embodied energy of the server-setup itself. Also the data would have to be copied across the ocean at least once. All that said, I am curios to see if it was worth at a certain amount of bits less that have to cross the ocean.
Another point that I find lacking about lifecycle and internet energy usage calculations that I have seen so far, is not just calculating / talking about the embodied energy of the direct infrastructure (i.e. servers, network, and end-use devices) but of the surrounding / indirect infrastructure needed to get everything designed, manufactured, into the right place things. So I am talking about the energy needed to design and test a specific product, the energy needed to build and maintain a factory where everything gets produced, including the trucks, tools, streets, etc. needed to be able to build the factory. There is also energy cost in delivering the items where they need to be, e.g. delivering the server from its manufacturing place to the buyer, or setting the cable from the US to Europe into the ocean. And of course there is also further impact than just energy usage, e.g. the space that is taken up by data centers, factories, streets, etc. can generally not be used for CO2 sinks (e.g. trees) and contributes to a reduced biodiversity in that location.
Of course the energy/CO2 cost of that wider infrastructure is spread between many many more users, but I still find it is something we need to talk about more. Where in my opinion this becomes most interesting is if one could eliminate a whole production chain, e.g. if we reduce our plastic usage by 90% we still need some of the underlying infrastructure, but if it is reduced by 100% all the direct infrastructure that is involved in the production and delivery is not needed anymore and all the indirect infrastructure has one thing less that is dependent on it and could potentially be reduced if replaced by more local products.
If we now take this to the internet, what if 100% of the websites where built-up decentralised in peoples apartements, then no datacenters would need to be built, no extra infrastructure to serve data from the data centers would be needed to be produced or transpored. And since apartements generally already have that infrastructure the full embodied energy should be lower for such a setup. Also I would argue that the overall distance that data travels can be reduced and it would be easier to shut off entire servers for local services in a planned manner.
Another interesting thing about datacenters, while they generally can utilise servers more efficiently, they are also driven to always have enough spare capacity, so if clients need extra capacity or new clients want to use the service, they do not have to wait for new servers to be bought and installed.
A last thing I am be curios about, if a server is now being turned off, planned, 4-5 hours each day would that change its life expectancy? If so it could make having local servers for local services also more interesting.
Mario Stoltz
Hello Kris,
great that you provide all of us this data - though I guess many people (e.g. IT managers of even smaller companies) will struggle with the question how they might put this into reality for their case, I think it is great to see and prove that and how this can be done. This hands-on approach is one of the things that I profoundly appreciate about Low-tech Magazine over the years.
One comment: in section “Energy use in the Network”, you say “Energy use in the Network is directly related to the bit rate of the data traffic…”. I think the statement requires a closer definition. Even if there were no active internet traffic, i.e. if all devices in the internet were simply switched on but in their idle mode awaiting communication, they would still hum and blink and consume a surprising quantity of power.
Therefore in reality, Energy use in the network is the sum of a) a certain base load which is approximately constant (or depends on how many devices are currently switched on), and b) a dynamic load which indeed scales, but not with nominal bit rate, but with gross* data traffic per time. This would be measured in bits per second – but not in nominal “this is my max data rate” bits per second, but in a value that measures how many bits are really transmitted. The internet is largely asynchronous and consumes less energy if there is less traffic.
*) gross, not net, because of course the communication overhead (packet headers, metadata, checksums etc) also counts in.
Kind regards,
Mario.
Clinton Nolan
Very interesting analysis.
I think you should have two servers, one located in the US (preferably as far south as possible, and/or in a state with excellent weather such as Arizona) and the other in Europe, since these two locations are where you say most of your readership is based. The rest of the world can incidentally be served by these two servers. After all, you only have a need for continuous uptime due to how many people worldwide are interested in your site, which means means you should be able to find someone interested in hosting your site in the US.
Two servers in such different locations using 86.4Wh batteries and 10W solar panels would likely have more or less 100% uptime.
The more I think about it, Arizona really would be an ideal location for a solar server. It’s pretty far south, the weather is very clear, and it is far to the west, so its even further from Europe than an eastern or midwestern US location would be.
@Amos
What you’re proposing sounds like a solar CDN. https://en.wikipedia.org/wiki/Content_delivery_network
Speaking of, one major factor that might not have been accounted for in this analysis is the fact that the network includes CDNs (such as Cloudflare) that are caching your website and serving up your content on your behalf, especially since it is static content (which is easy to cache, they can basically cache and serve up the whole website). In fact, it’s very likely that most of the US traffic never reaches Barcelona, since traffic across the submarine data cables is relatively expensive, while a CDN can pick up one copy of the website and serve it to us in the US over and over again. While the CDN is crucial to the efficiency of the network, what is their energy situation like?
Fabian
Hi Kris,
thank you for the detailed article! I was thinking about reducing the energy consumption of the end-user devices. I am often downloading longer articles as epub (via the Firefox extension ePub Creator) and read these on an ebook reader. Have you thought about directly providing an epub version of your articles, perhaps even with a simple list/directory to browse on the ebook reader itself? I don’t have exact numbers, but would expect this to reduce energy consumption also on the end-user side.
Fabian
Arthur
ODROID-C4 has 12nm SoC and 12V DC power input. It uses less power than most SBCs in 2023 :) solar.lowtechmagazine.com could benefit from Brotli’s pre-compressed pages and FileOptimizer’s compressed images. FileOptimizer can yield ~10% lower PNG file size. Brotli can compress better compared to GZIP. Flexible electricity demand could be implemented. For example, running a P2P CDN node during summer when power is plentiful. Could also play with undervolting and underclocking. lowtechmagazine.com could benefit from AVIF images reducing image size by half. If space is at a premium double-sided monocrystalline panel could be a better option :) When it comes time to replace the battery. B-grade LiFePO4 cells are cheaper per cycle than lead acid if run at 80% DoD.
Patrik
Hi!
Just found your website and the fact that you run it on solar. Let me give you my thoughts on using solar and batteries.
The best batteries to use are Nickel-Iron (NiFe) batteries. The second best are Nickel-Cadmium (Ni-Cd). The worst are Lead of any type. Let me explain.
Lead batteries are a scam. They are damaged every time they are discharged. They also have a steep voltage drop as they are loaded and discharged, so the advertised capacity cannot be utilized. They are also effected by temperature, especially low.
Open lead batteries can be reviewed somewhat by applying a high-current charge to them. This will boil the batteries so the water level needs to be monitored and topped off. A stick welder is my preferred method of reviewing lead batteries. I only use them in cars since it is very difficult to find other types of batteries for cars. Note that the industry have started using sealed batteries for this reason; they do not want you to be able to extend the life of this useless battery type.
Also do not use Lithium based batteries. They are very expensive and if they catch fire there is nothing you can do to stop them burning. Lithium batteries are also damaged when discharged and the scam industry limit their charge to about 80% to increase the wear on them. Lithium batteries have a use when small weight is needed, as in mobile devices. Other than that, they should be avoided.
Now onto the two battery technologies that I recommend.
Nickel-Iron batteries will last you a literal lifetime, two if cared for. We are talking about 100+ years of operation. They will last longer if you discharge them, meaning the more you use them the better they work! They will also not drop in voltage as they are being loaded.
Nickel-Cadmium have the same properties as Nickel-Iron but with one advantage and one disadvantage. The advantage is that they can hold more charge per volume and weight, the disadvantage is that they do not last as long as Nickel-Iron. They can still last 50+ years.
Try to find Nickel-Iron batteries, they are difficult to find but if you do you have a battery for life. Nickel-Cadmium are easier to find since they are in use to this day. The railway and airline industry uses a lot of Nickel-Cadmium batteries and they are constantly replaced after a decade or two of use, where they will still have years to decades of use in them left. The railway signal system is powered by Nickel-Cadmium batteries and that is where I get mine for free. Just go and have a chat with a line maintenance worker, especially ones that work on the signal system. Old locomotives can have Nickel-Iron batteries but they tend to be very large and heavy.
Nickel-based batteries needs to be taken care of. They need to be topped off with distilled water and if they lose capacity the electrolyte needs to be replaced. After service they will retain their full capacity, meaning they will perform as new again.
Batteries connected in parallel is more important than the efficiency gained when using higher voltage obtained by connecting them in series. This is even more true for you that needs to down-convert the voltage to 5V.
If you continue to use lead based batteries connecting several in parallel will protect the battery bank since they will not be discharged as much as a single battery. You can collect discarded batteries from a recycling center or any car mechanic. Only collect batteries that are of the open type, meaning they have lids for refilling the cells with electrolyte. Revive the batteries by flushing them and over-charging them with a welder. That way you will not have to spend money on new batteries. Just make sure that you only use batteries that you manage to revive to a decent working condition. A bad battery will act as a resistor and pull the battery bank down. There are plenty of videos on YouTube showing how to revive batteries using a stick welder.
Solar panels are not made equal. They perform differently in different conditions. Cloud cover and temperature are the two most important to look for. The overall efficiency of the panels are not as important as efficiency in low light conditions. So use panels that are efficient in low light conditions and that are more resilient against high temperatures. Since you use so little power I would just use a higher capacity solar panel. If you own more panels already, set one extra up aimed for the morning sun (must use a separate charge controller) for a quick morning battery bank boost.
Patrik
Forgot to mention solar panel alignment (and some bonus thoughts).
I would not invest in solar tracking. It’s expensive and prone to failure. Instead just purchase higher capacity solar panels for some low light spare capacity (winter with cloud cover).
What I would do is mount the solar panels on a mount that can be manually adjusted vertically. This can be cheaply manufactured at home using scrap wood and some bolts. This way the panels can be adjusted from time to time against the suns seasonally changing vertical position in the sky. If the panels are rigidly mounted (non-adjustable) they should be aimed for highest efficiency in the winter when the sun is at its lowest position.
Also I would aim for 100% availability.
Changing lead batteries every 3 years is not sustainable. That is your biggest flaw in your current system.
Because lead-acid batteries should not be discharged below half of their capacity.
Lead batteries should not be discharged at all. Zero. Any discharge damages them. Don’t use them. It’s a scam.
Nickel-Iron batteries can be purchased new. They are (to my knowledge) only manufactured in China. They are expensive to purchase but will last longer than you, so in the long run they are the cheapest.
Nickel-Cadmium batteries can be purchased new. They are manufactured by several manufacturers but are expensive because they are heavily taxed because of scam “Cadmium is bad” lies. They are no worse than Lead- or Lithium- based batteries and I would argue that they are much better since they last decades, not a few years. Sustainability vise I would go for free, second-hand Nickel-Cadmium batteries. There is a recycling environment fee that companies have to pay when recycling the batteries. If they give the batteries to you for free they do not have to pay the fee. Win-win.
Patrik